The vast majority of companies tout the importance of user experience, but few actually leverage data to regularly modify their product designs over time. By ignoring data, you risk creating offerings that struggle to attract and keep users engaged.
A smarter approach is a data-driven design that combines quantitative and qualitative data in the design process. Together, those data can inform every single design decision you make so you can build usable and enjoyable digital experiences that match your user behavior.
This article explores this concept and also covers effective ways to implement a data-driven design process in your organization.
What is data-driven design?
As Marty Cagan, author of Inspired: How to Create Tech Products Customers Love, notes, “We need design — not just as a service to make our product beautiful — but to discover the right product.”
This is where data-driven design comes in. It lets real data — not just assumptions — guide the product design process. Data-driven design involves quantitative data for metrics and trends, as well as qualitative insights for a nuanced perspective on user needs, motivations, and emotions. But more about each data type later.
Let’s take a deeper look at what you can achieve with data-driven design.
Benefits of data-driven design
You’re wasting potential if you’re not capitalizing on the limitless data at your fingertips.
Here are some advantages of integrating data-driven design into your product design process.
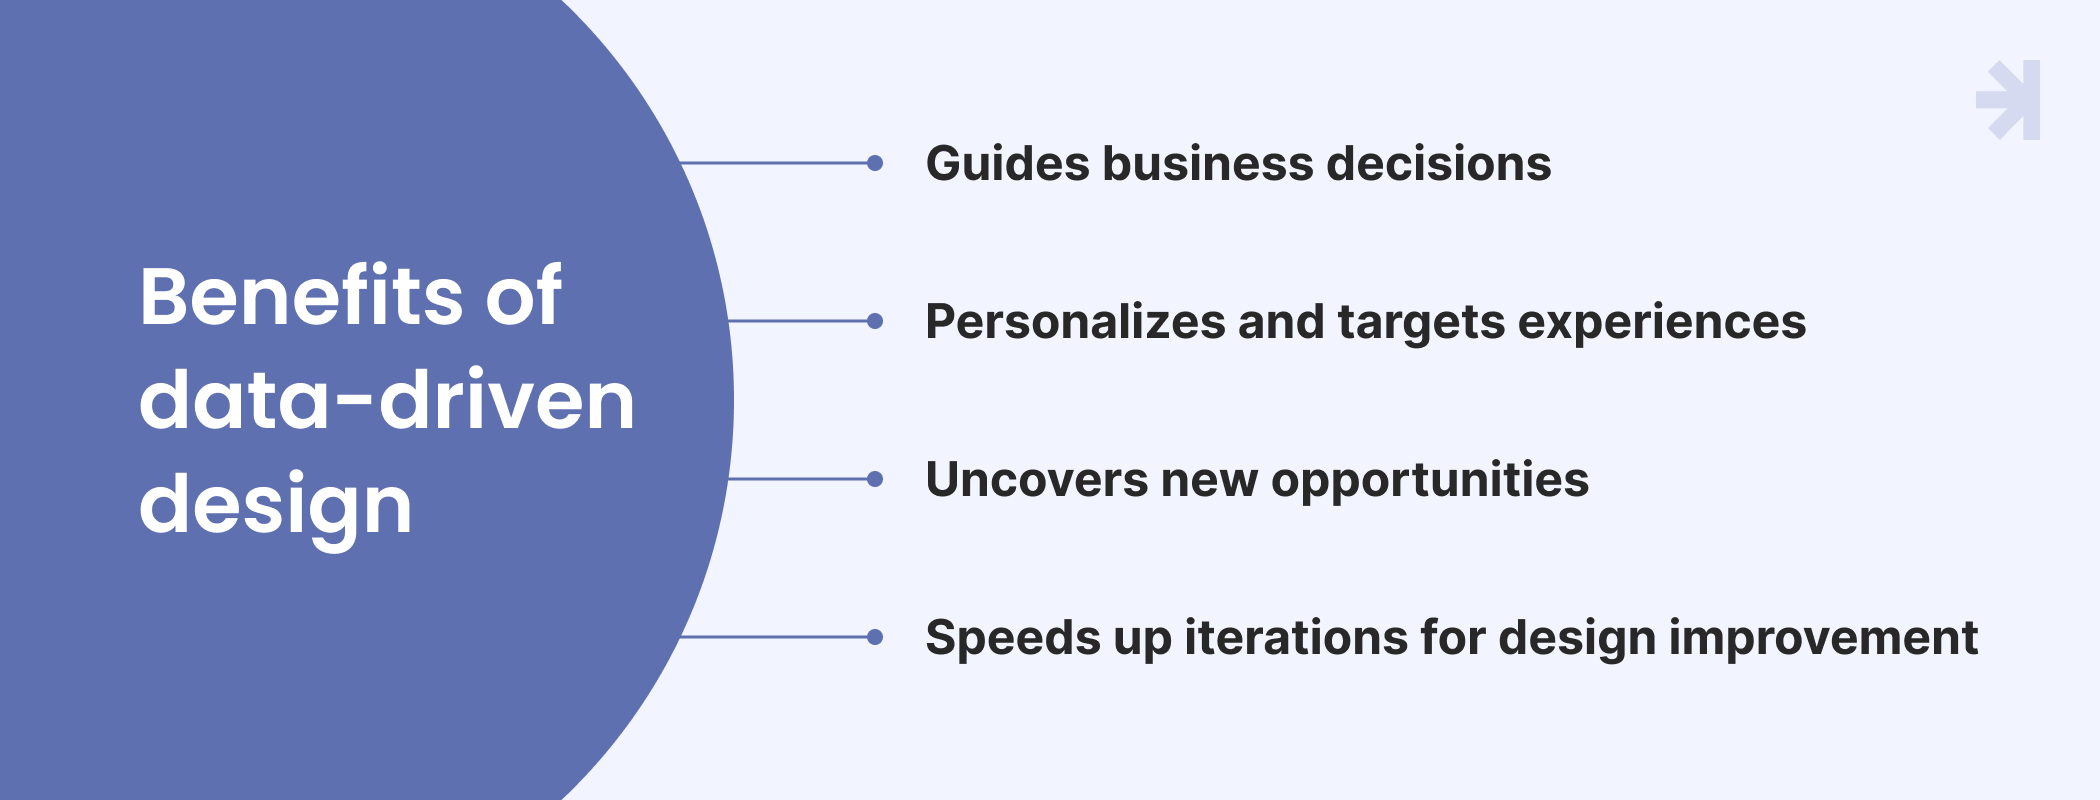
Speeds up iterations for design improvement
Product design is a process of constant testing, and data lets you iterate way faster.
For example, by tracking how beta users interact with your product and where they hit snags, you can quickly make improvements where needed, removing uncertainty from product–market fit.
Personalizes and targets experiences
The more data you have about your customers, the more finely you can segment your audience to tailor experiences to your target audience.
For example, you can segment users by intent, demographics, location, and other attributes and based on this data, deliver customized interfaces, content, recommendations, and notifications. Focusing design on the most valuable segments maximizes usefulness for those groups.
Uncovers new opportunities
User behavior data can reveal new opportunities for user engagement beyond the original intent.
For example, paying attention to users when they employ products in unintended ways gives you data about users’ unmet needs, and thus, a chance to fill a niche no other product offers. Similarly, user support ticket requests can provide valuable insight into changes users want. Letting user data guide you can lead to valuable decisions not obvious from the outset.
Guides business decisions
In addition to meeting customers’ needs, design must also fulfill business goals. Data enhances decisions, like where to focus design resources.
For example, in usability testing, users may struggle to find the right menu options to access key features. The design team can then devote more time to clarify the interface through iterative testing.
Plus, metrics help quantify a design's ROI to demonstrate the design’s value, get stakeholder buy-in, and enable designers to align their work with business objectives.
Ultimately, a data-driven approach removes bias and focuses efforts. But this only works when you blend both metrics (quantitative data) and qualitative research. Let’s examine each data type separately.
What quantitative data is, and why it matters in product design
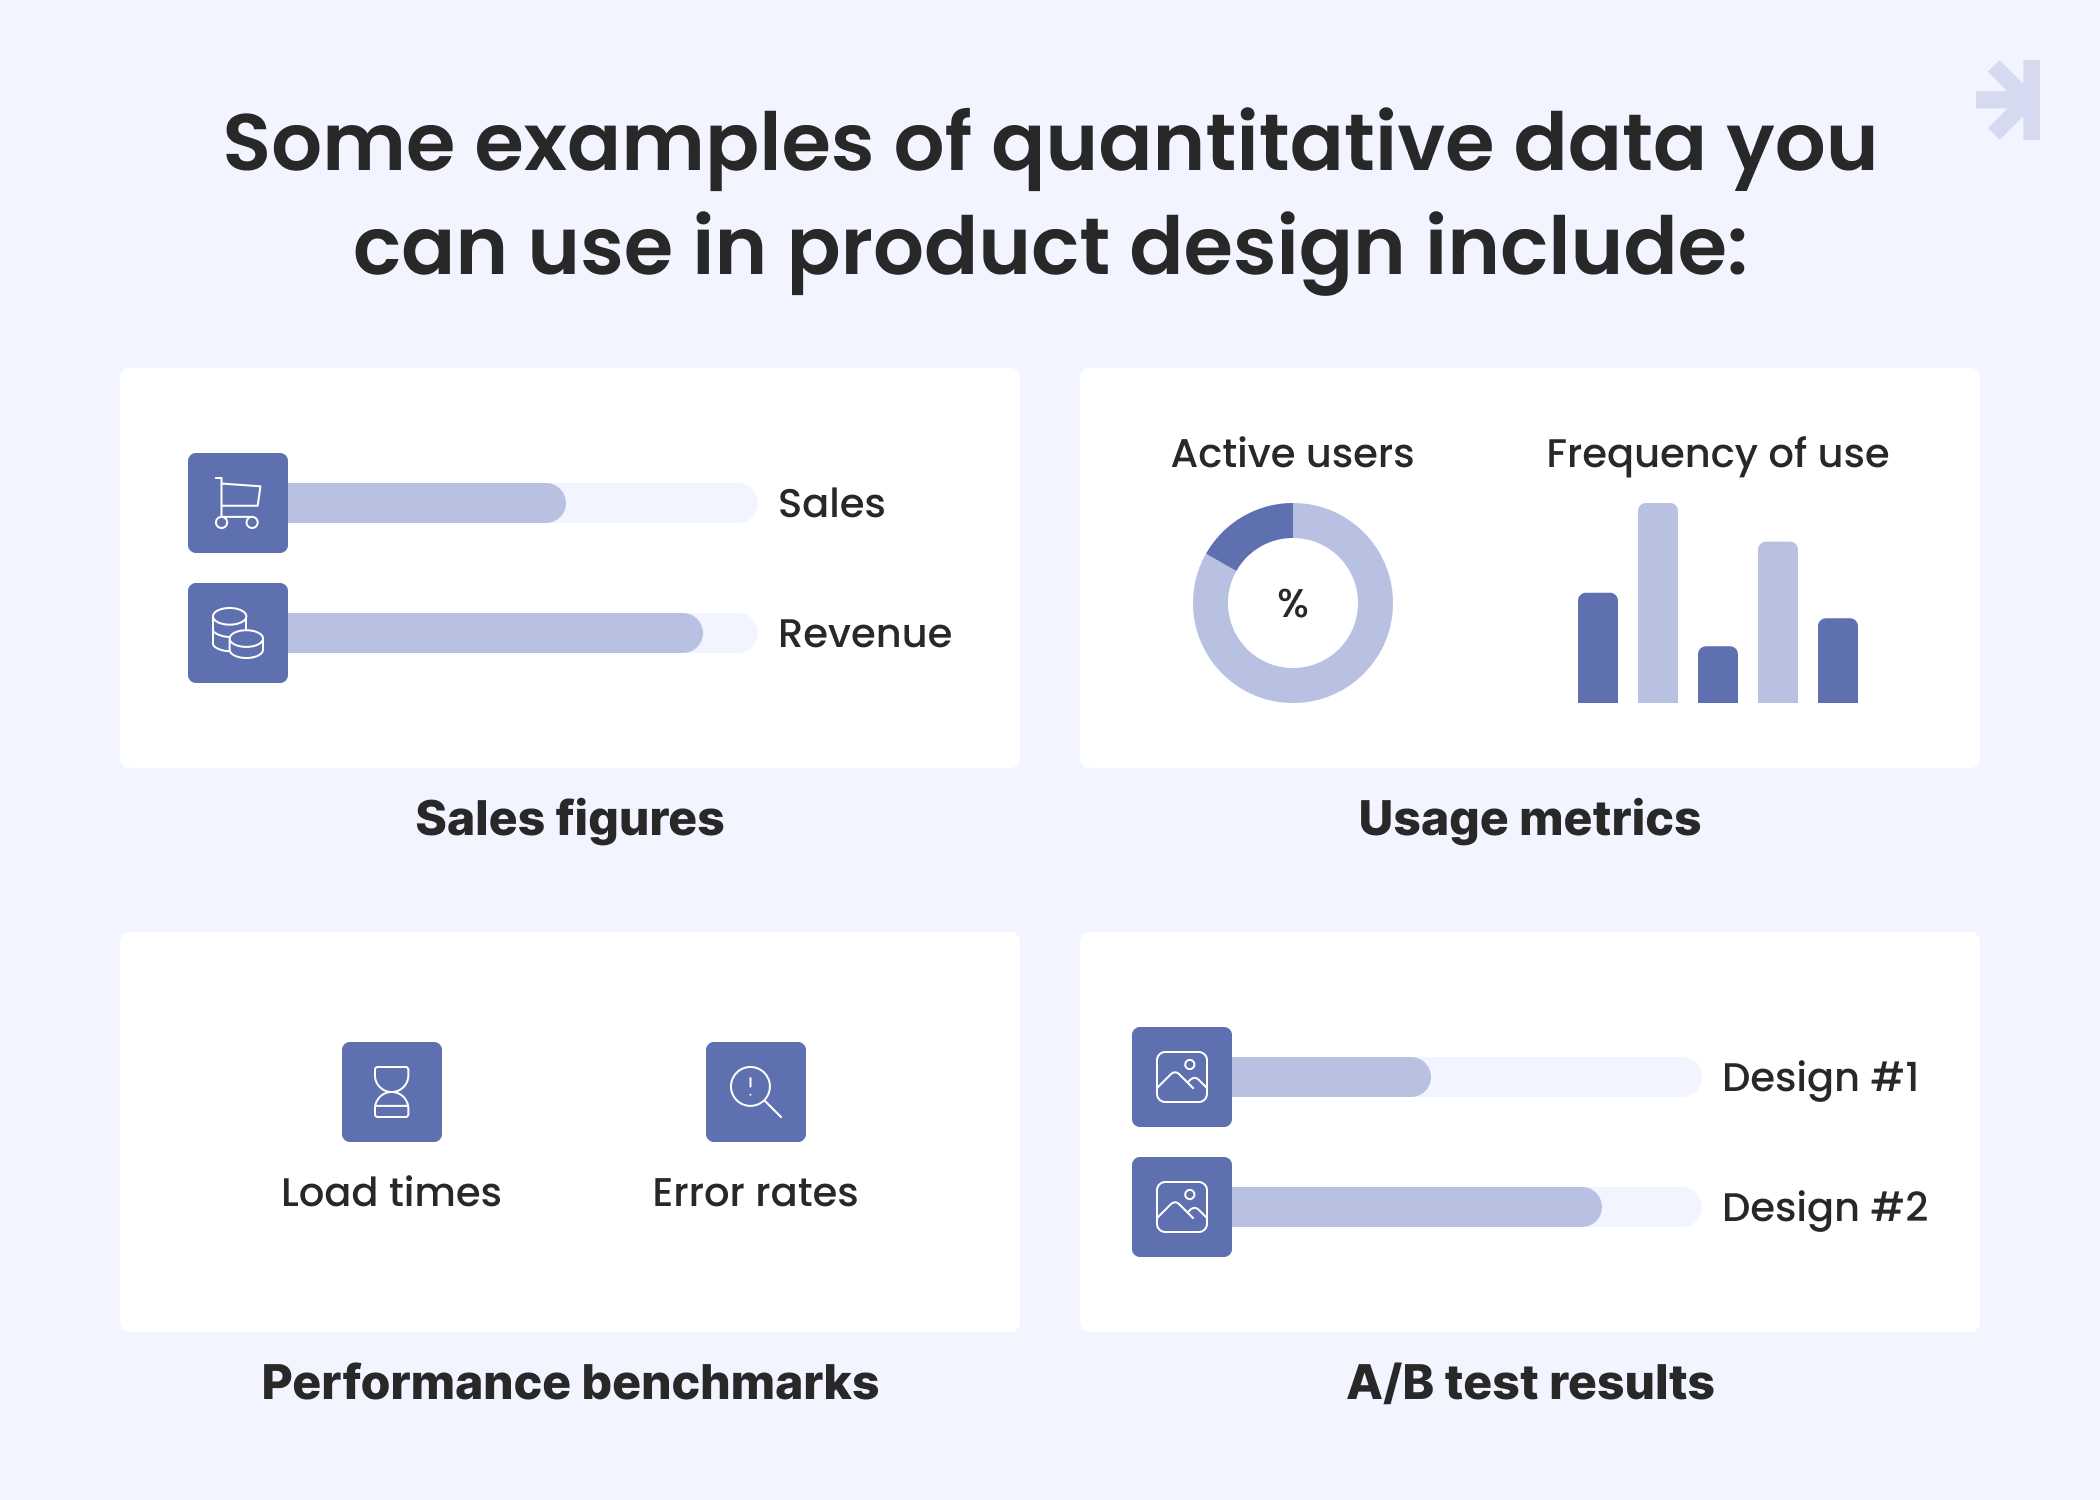
Quantitative data is objective and focuses on numbers that can be measured, tallied, and analyzed. Some examples of quantitative data you can use in product design include:
- Sales figures (number of units sold, revenue generated)
- Usage metrics (number of active users, frequency of use)
- Performance benchmarks (load times, error rates)
- A/B test results with statistics on conversions, click-throughs, and other data
Here are several ways quantitative data can work to your advantage.
Gives you precise insights into user behavior
Numbers can reveal exactly how users interact with product elements. You can see how often users click different buttons and how much time they spend in different screens. You can use these measures to create heat maps that show the most eye-catching areas of a UI.
Reveals benchmarks for objective evaluation
Quantitative data offers definitive metrics to measure the impact of design choices. For instance, you can track how a new onboarding user flow affects account sign-up conversion rates week-over-week and adjust the flow accordingly.
Tracks trends for future planning
Without numbers, you risk steering blindly into the future. Instead, you can analyze time-based trends in usage metrics to forecast where user needs are heading. Or identify a declining frequency of user behavior to remove outdated design choices before they drag down the product.
While numbers explain what users do, qualitative data reveals why.
What qualitative data is and why it matters in product design
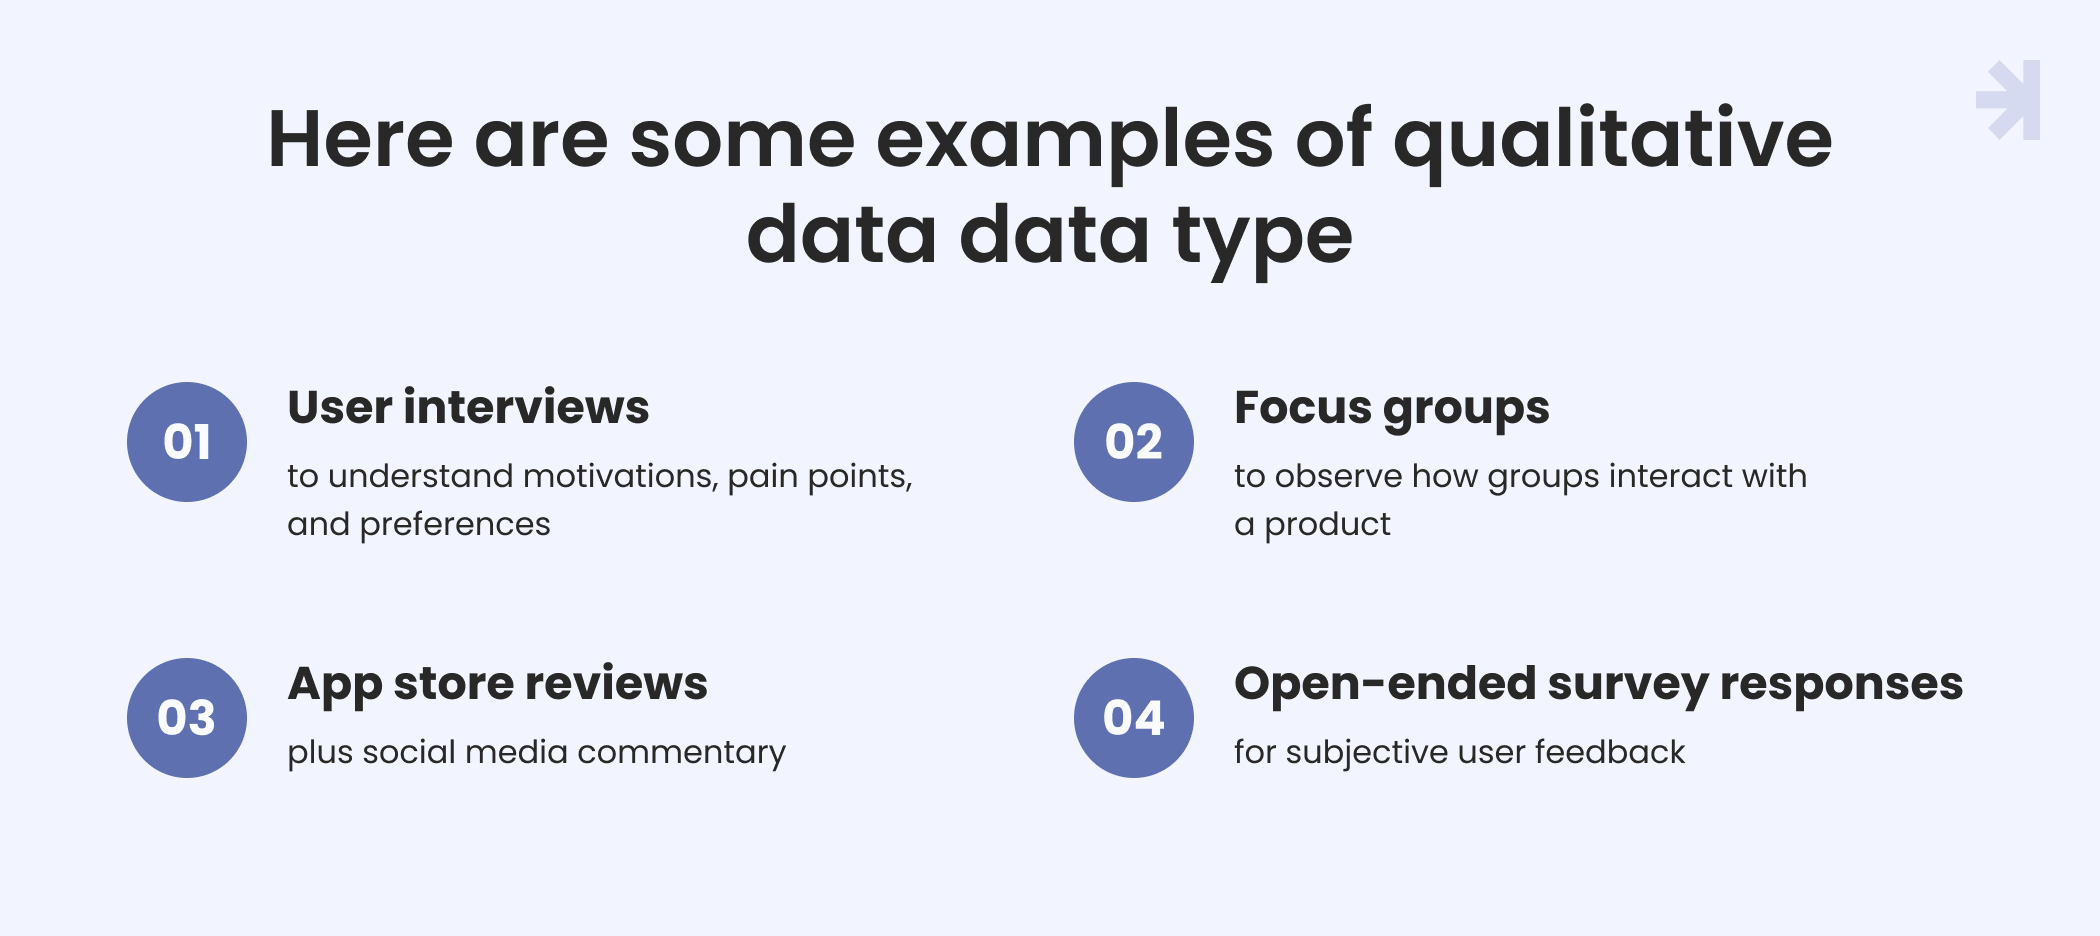
Qualitative data is subjective, non-numerical feedback. Here are some examples of this data type:
- User interviews to understand motivations, pain points, and preferences
- Focus groups to observe how groups interact with a product
- Open-ended survey responses for subjective user feedback
- App store reviews and social media commentary
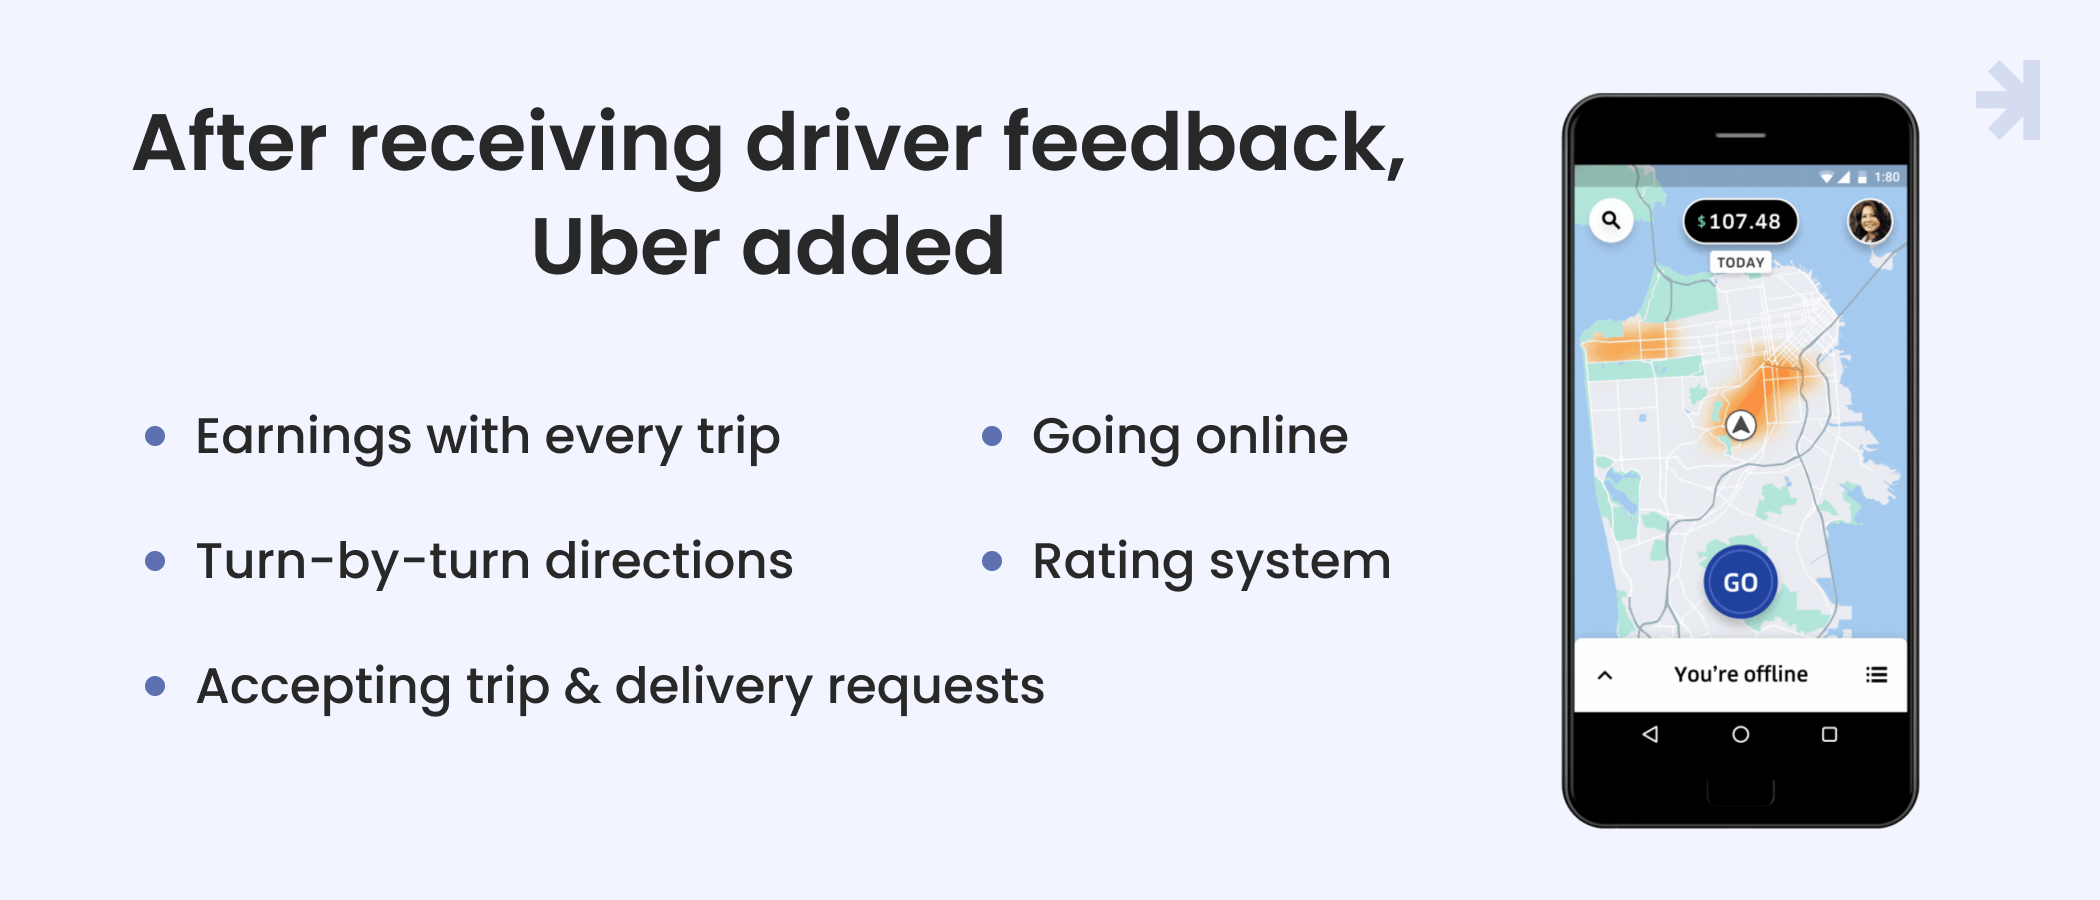
Watching real people use a product catches issues you'd barely predict with metrics alone. Take Uber, which redesigned its app based on qualitative research, like interviews with local drivers. The company found out that some drivers had to record their income with a pen and pad. Others complained about having to log into computers to complete administrative tasks.
Uber created a new interface based on drivers’ feedback and now drivers can manage their business directly in the app. The redesigned app has a personalized newsfeed with notes from Uber, ride information, and even hints to optimize income and ratings.
As you can see, incorporating qualitative user research is worth the effort. Let’s break this down into the main benefits of such an approach.
Uncovering of hidden user needs
Interviews and diaries detect latent frustrations not revealed through quantitative data. For example, a workflow may be technically effective but makes users feel overwhelmed or confused. This insight highlights opportunities to improve users’ emotional experience.
Delivering delight
User interviews, along with open-ended survey responses, can also indicate a lack of user emotional connection with your product. Using these qualitative insights to add artful, joy-sparking details to your UX can prevent frustrations in your audience. Take animated micro-interactions when accomplishing tasks or charming error messages that add humor. Attention to these details creates emotional bonds.
While qualitative user research offers the human context missing from the numbers, the best results come from pairing it with metrics. Together, these two types of information enable true data-driven design. Let’s see why you shouldn’t compromise on this balance.
Synergy in action: Integrating quantitative and qualitative data
Thoughtfully integrating both data types enables more advanced analysis. Qualitative UX research can help explain confusing or counterintuitive statistical results. Or qualitative data can be used to generate a useful hypothesis, and quantitative data can then test those hypotheses at scale. That’s the approach Airbnb used.
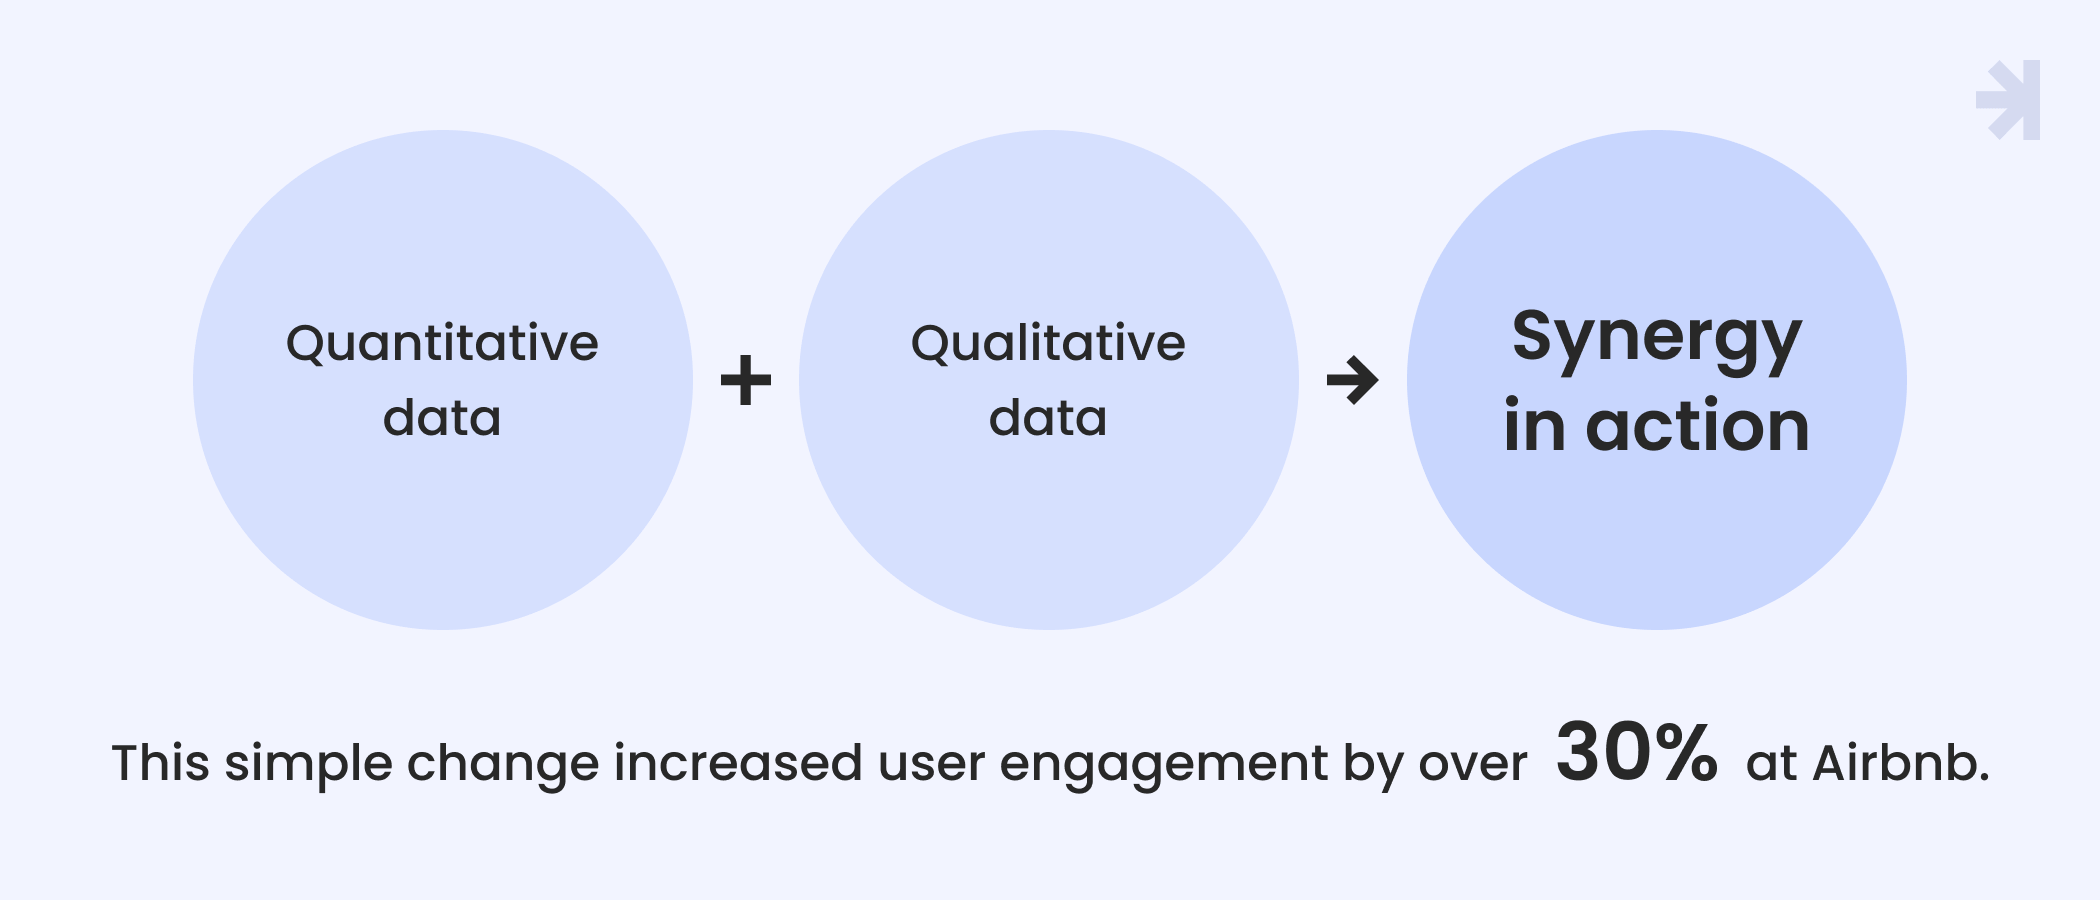
Every new Airbnb employee would get an unusual assignment. For example, one employee was assigned to reevaluate the function of the “star”, which previously allowed users to bookmark properties. He proposed replacing the star with a heart icon since stars felt functional while hearts could make a sterile accommodation search more aspirational and engaging (qualitative data). This simple change increased user engagement by over 30% (quantitative data).
If you're determined to achieve the same kind of success as Airbnb, Duolingo, and Uber, here’s how you can make it happen.
Crafting a data-driven design process
Implementing a data-driven design process can be tricky. To get your data-driven approach off to a great start, consider the following best practices.
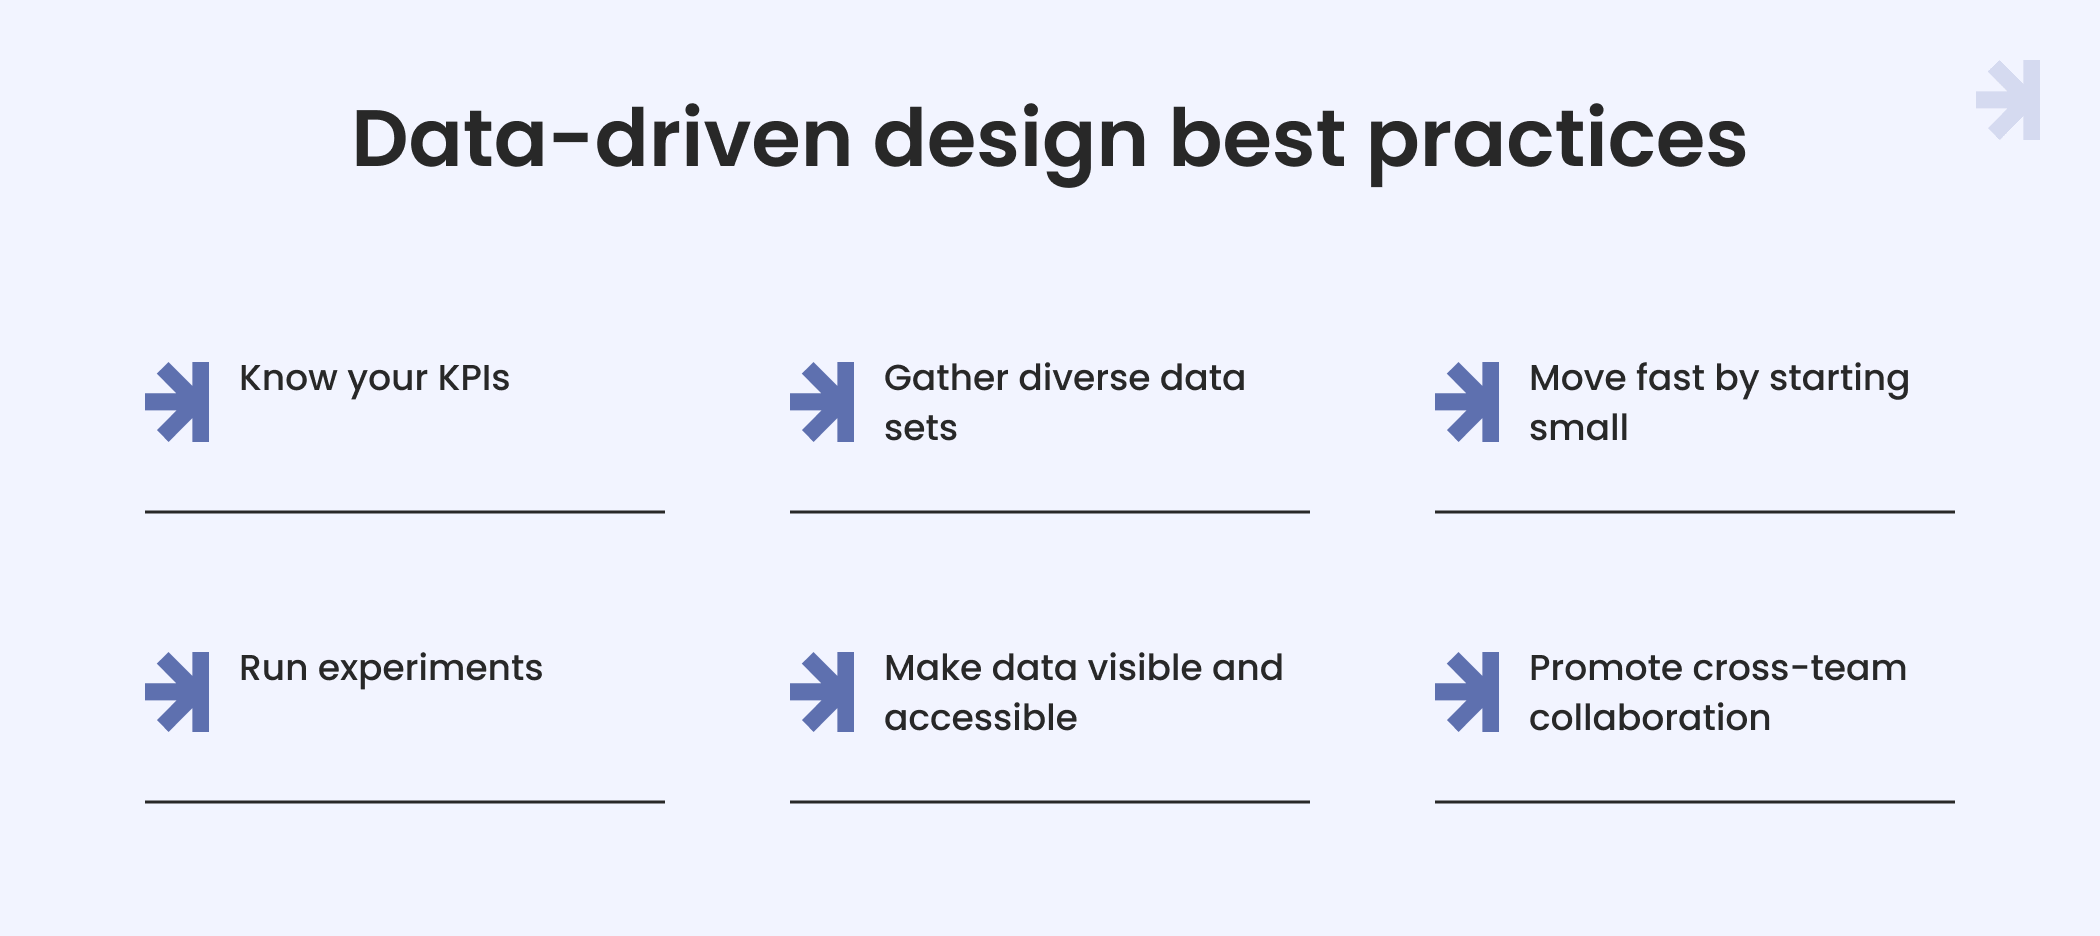
1. Know your KPIs
You can’t optimize what you don’t measure. Start by identifying the key performance indicators (KPIs) that matter most to your product and business. Do you care most about user engagement, conversions, retention, or something else? Focus your design team on three to five priority KPIs that will steer your data-driven decisions.
2. Gather diverse data sets
A 360-degree view combines analytics from product usage with qualitative insights from UX research activities. Ensure you incorporate data from multiple sources — app metrics, web analytics, surveying, interviewing, observation, and more.
3. Move fast by starting small
Big data can inspire big redesigns, but seismic changes take time and risk-breaking things. Favor small, rapid experiments: tweak a headline, add an interaction, change a color. See how it impacts KPIs and qualitative research, then iterate. Compounding many micro-wins is faster and safer than betting on major redesigns.
4. Run experiments
Analytics show what is happening, but optimization requires action. You need to actively experiment by creating and rigorously testing alternative designs. Run A/B tests, multivariate testing, prototyping testing, usability testing, and so on to see what designs best move your KPIs and qualitative data.
5. Make data visible and accessible
Nothing drives decision-making better than visibility into the data. Invest in dashboards, reports, and data tools that make analytics data easy to monitor and act on for everyone on the team. Create a “single source of truth” for your data.
6. Promote cross-team collaboration
Leveraging data requires breaking down silos between departments. Designers, product managers, data scientists, engineers — all need to collaborate closely as a design team.
Designers should lean on data from scientists and UX experts to help decipher valuable insights from analytics and user research. Product managers need to frame sprint goals based on data trends and business objectives. Engineers provide reality checks on what's technically feasible. Regular sync-ups and shared tools are essential so everyone's on the same page data-wise.
Conclusion
A data-driven design process offers a powerful framework for creating products and experiences that provide users with what they want. By taking a metrics-informed yet human-centered approach, you can iterate quickly, delight users, uncover hidden opportunities, and align design with business goals.
Data-driven design succeeds when diverse teams thoughtfully synthesize quantitative and qualitative data. Balancing these two types of data maximizes the advantages of metrics while keeping the human element central. Data doesn't lie — lean into it fully to enhance product-market fit and user adoption and retention.
FAQ
1. What is data-driven design, and how does it differ from traditional design methods?
Data-driven design utilizes actual data instead of intuition to inform design choices. It expands gut-driven design by incorporating both quantitative methods and qualitative feedback.
2. What types of data are typically used in data-driven design?
The main types of data are quantitative and qualitative. Quantitative data includes clicks, conversions, sales, and other metrics that can be numerically quantified. Qualitative data comes from sources like user interviews, surveys, and direct observation of users.
3. How can data-driven design benefit businesses?
Data-driven design benefits businesses in several ways. It facilitates a clear understanding of customers and helps you build what they want. It optimizes conversions by guiding design to prompt more user actions. And it provides evidence to support informed decision-making instead of making assumptions.
4. Are there any potential challenges for implementing data-driven design?
Challenges include collecting quality, relevant data to analyze. Data can introduce bias and incorrect conclusions if you only consider data that confirms existing beliefs. Turning data into insights requires resources and data skills.
5. How can I implement data-driven design principles in my projects?
Start by auditing your existing data and identifying key metrics. Get user feedback through surveys, interviews, and usability testing. Then, let the data guide your design iterations and optimizations.